
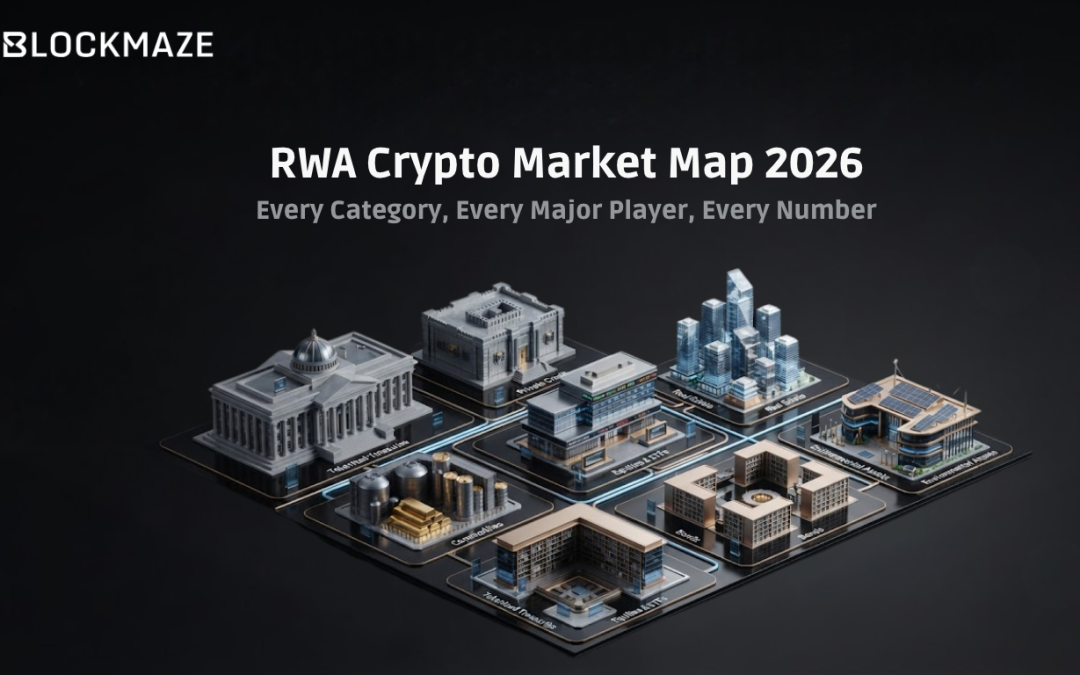
Executive TL;DR• The RWA crypto market holds $37.89 billion in distributed asset value as of August 2026, across six primary asset categories: government debt, private credit, tokenised equities, tokenised commodities, real estate, and tokenised funds. Ethereum holds approximately 65% of total on-chain RWA value across public blockchains. • Private credit has overtaken US Treasuries as the single largest non-stablecoin segment. Tokenised gold recorded $90.70 billion in spot trading volume in Q1 2026 alone. The tokenised equity market capitalisation reached $2.3 billion by mid-July 2026. • The market has three distinct tiers of institutional participants: infrastructure providers (Securitize, Fireblocks, DTCC technology), issuers (BlackRock, Franklin Templeton, Ondo Finance, Maple Finance, Centrifuge), and distribution and trading venues (NYSE Digital Trading Platform, Binance bStocks, Kraken xStocks, Aave Horizon). • Concentration risk is real: three issuers — Ondo Finance ($955M), Kraken xStocks ($507M), and Binance bStocks ($500M AUM) — collectively account for a dominant share of the tokenised equity market. BUIDL at $2.5B+ AUM represents a similar concentration in tokenised money market funds. • The market’s growth trajectory has shifted. From 2021 to 2024, the market grew slowly through infrastructure building. In 2025, it grew exponentially as institutional products launched. In 2026, it has entered a third phase: adding holders rather than primarily adding dollars, with wallet growth of 56% in a single month representing a different kind of market maturation. |
A market map requires a choice of what to map: by asset class, by issuer, by blockchain network, by investor type, or by regulatory status. The RWA crypto market in 2026 can be usefully mapped by all five, and each reveals a different dimension of how the market is structured and where it is going. What follows is a systematic mapping across each dimension, using the most current verifiable data available.
By Asset Category
| Asset Category | Current On-Chain Value | Key Issuers | Key Developments in 2026 |
|---|---|---|---|
| US Treasuries / Government Debt | $10B+ (March 2026) | BlackRock BUIDL ($2.5B+), Franklin Templeton BENJI, Ondo Finance USDY, Superstate | BlackRock BUIDL accepted as institutional DeFi collateral; Franklin Templeton / Ondo partnership for 24/7 tokenised ETF access |
| Private Credit | Largest non-stablecoin segment (overtook Treasuries) | Centrifuge, Maple Finance, Goldfinch, TrueFi, Figure | Private credit overtook Treasuries as the largest non-stablecoin RWA category in Q2 2026; demand driven by yield premium over Treasuries |
| Tokenised Equities | $2.3B market cap (mid-July 2026) | Ondo Global Markets ($955M), Kraken xStocks ($507M), Binance bStocks ($500M AUM) | DTCC first live tokenised securities July 15 2026; Binance bStocks $500M AUM in 7 weeks; 700+ equities on BNB Chain |
| Tokenised Gold / Commodities | $90.7B Q1 2026 spot trading volume | PAXG (Paxos), XAUT (Tether Gold) | Q1 2026 gold trading volume already exceeded all of 2025; gold outperformance drove crypto-native demand |
| Tokenised Real Estate | Limited institutional production | RealT, BRICKS, Landshare | Most complex category; legal title, valuation, and liquidity constraints limit scale |
| Tokenised Funds / MMFs | $2.5B+ (BUIDL alone) | BlackRock, Franklin Templeton, VanEck, WisdomTree | VanEck treasury fund added to Aave Horizon in July 2026 |
By Blockchain Network
| Network | RWA Market Share | Key Advantage | Key Limitation |
|---|---|---|---|
| Ethereum | ~65% of on-chain RWA value | Largest liquidity base; deepest DeFi composability; most institutional compliance standards built for EVM | Transaction costs during congestion; slower than newer L1s |
| BNB Chain | ~30% of tokenised equity market share | Binance ecosystem distribution; 700+ tokenised equities; $5B+ cumulative trading volume | Concentrated in Binance bStocks; less institutional compliance infrastructure |
| Solana | $4.9B tokenised equity volume H1 2026; $10B+ cumulative transfer volume | High throughput; low cost; Jupiter DEX for after-hours trading | Less institutional compliance tooling than EVM chains; validator concentration concerns |
| Polygon / Arbitrum / Base | Growing share | Lower cost EVM-compatible alternatives | Fragmentation risk; liquidity thinner than mainnet Ethereum |
By Institutional Player Tier
Tier 1: Traditional Finance Entrants (Scale and Credibility)
- BlackRock: BUIDL ($2.5B+ AUM) — the reference product for institutional tokenised MMFs; accepted as on-chain collateral; validates public Ethereum for institutional use.
- Franklin Templeton: BENJI — tokenised money market fund operating since 2021; partnership with Ondo Finance for 24/7 tokenised ETF access in H1 2026.
- JPMorgan: Kinexys ($1.7B daily repo) — highest-frequency institutional blockchain production volume; most operationally mature institutional deployment.
- NYSE / ICE: Digital Trading Platform — tokenised securities trading venue with Securitize as digital transfer agent; fundamental market structure commitment.
- DTCC: First live tokenised securities trades July 15, 2026 — the single most consequential institutional blockchain validation of the year.
Tier 2: Specialist Infrastructure and Issuance Platforms
- Ondo Finance: $955M+ in tokenised equities; Franklin Templeton partnership; Ondo Global Markets platform for 24/7 tokenised ETF access.
- Securitize: $4B+ in tokenised assets; Apollo, BlackRock, KKR products; SEC-registered transfer agent; NYSE digital transfer agent designation; IPO via Cantor Fitzgerald SPAC at $1.25B valuation.
- Centrifuge: leading private credit tokenisation; pioneered the institutional DeFi integration of real-world credit instruments.
- Maple Finance: institutional private credit pools; $100M+ in active loans; institutional borrowers and lenders.
Tier 3: Distribution and Trading Venues
- Binance bStocks: $500M AUM in 7 weeks; 46+ tokenised equity listings; 24/7 trading; $2B weekend volume.
- Kraken xStocks: $507M in tokenised equities via Backed Finance partnership.
- Aave Horizon: $539.8M in RWA collateral assets; permissioned institutional DeFi lending with Circle, Franklin Templeton, VanEck partners.
The Concentration Problem
A systematic market map has to acknowledge the concentration risks it reveals. In tokenised equities, three issuers account for nearly half the market. In tokenised money market funds, BUIDL represents a dominant share. In blockchain network share, Ethereum holds 65% with BNB Chain capturing most of the equity market. In each dimension, the market is more concentrated than the ‘multi-issuer, multi-chain RWA ecosystem’ narrative suggests.
Concentration is not necessarily a problem at this stage of market development — early markets concentrate around the products that proved viable first, and diversification follows as additional issuers and networks mature. The risk is that a significant failure by a concentrated player (an issuer, a network, or a distribution venue) could have outsized market-wide effects. Institutional participants evaluating RWA exposure should size that concentration risk explicitly rather than assuming the headline $37.89B total reflects a diversified market.
Frequently Asked Questions
1. Which RWA category is largest by on-chain value?
Private credit has overtaken US Treasuries as the largest non-stablecoin RWA category by value as of Q2 2026, though exact figures vary by data provider depending on which permissioned platforms they track. Tokenised Treasuries are the largest in terms of publicly visible institutional products.
2. Which blockchain network holds the most RWA value?
Ethereum holds approximately 65% of on-chain RWA value across public blockchains. BNB Chain holds approximately 30% of the tokenised equity market specifically. Solana processed $4.9 billion in tokenised equity volume in the first half of 2026.
3. Who are the dominant institutional players in RWA crypto in 2026?
BlackRock (BUIDL, $2.5B+), JPMorgan (Kinexys, $1.7B daily repo), Franklin Templeton (BENJI), Ondo Finance ($955M+ tokenised equities), Securitize ($4B+ in tokenised assets across Apollo, BlackRock, KKR products), DTCC (first live tokenised securities), NYSE/ICE (Digital Trading Platform).
4. What is the realistic 2030 projection for the RWA market?
Projections vary widely depending on scope. McKinsey base case: $2 trillion by 2030. Citibank: $5.5 trillion in tokenised securities by 2030. Ripple/BCG: $18.9 trillion by 2033. Standard Chartered: $30 trillion by 2034. The $2 trillion figure is the most conservative and most widely cited by institutional research.
Blockmaze and the Concentration Gap
The concentration the market map reveals — three equity issuers holding nearly half the tokenised stock market, one MMF product dominating institutional DeFi collateral, Ethereum holding 65% of RWA value — reflects a market that has proved the easiest categories first. US Treasuries, money market funds, and public equities scaled quickly because they have liquid underlying markets, transparent pricing, and enormous existing institutional demand. The categories with the largest unmet institutional demand — private capital formation for infrastructure development, real estate construction, deep tech ventures, and entertainment financing — have not yet scaled because the compliance and governance infrastructure to connect institutional co-investors to those opportunities has not existed. Blockmaze is built to fill exactly that gap: the compliant, governed, composable infrastructure for private capital formation across asset classes the existing market map does not yet adequately address.
Disclaimer: This article is for informational purposes only and does not constitute financial or legal advice. Readers should conduct their own research and consult with qualified professionals before making any investment or business decisions.